A collection of datasets containing economic indicators for Switzerland.
Details
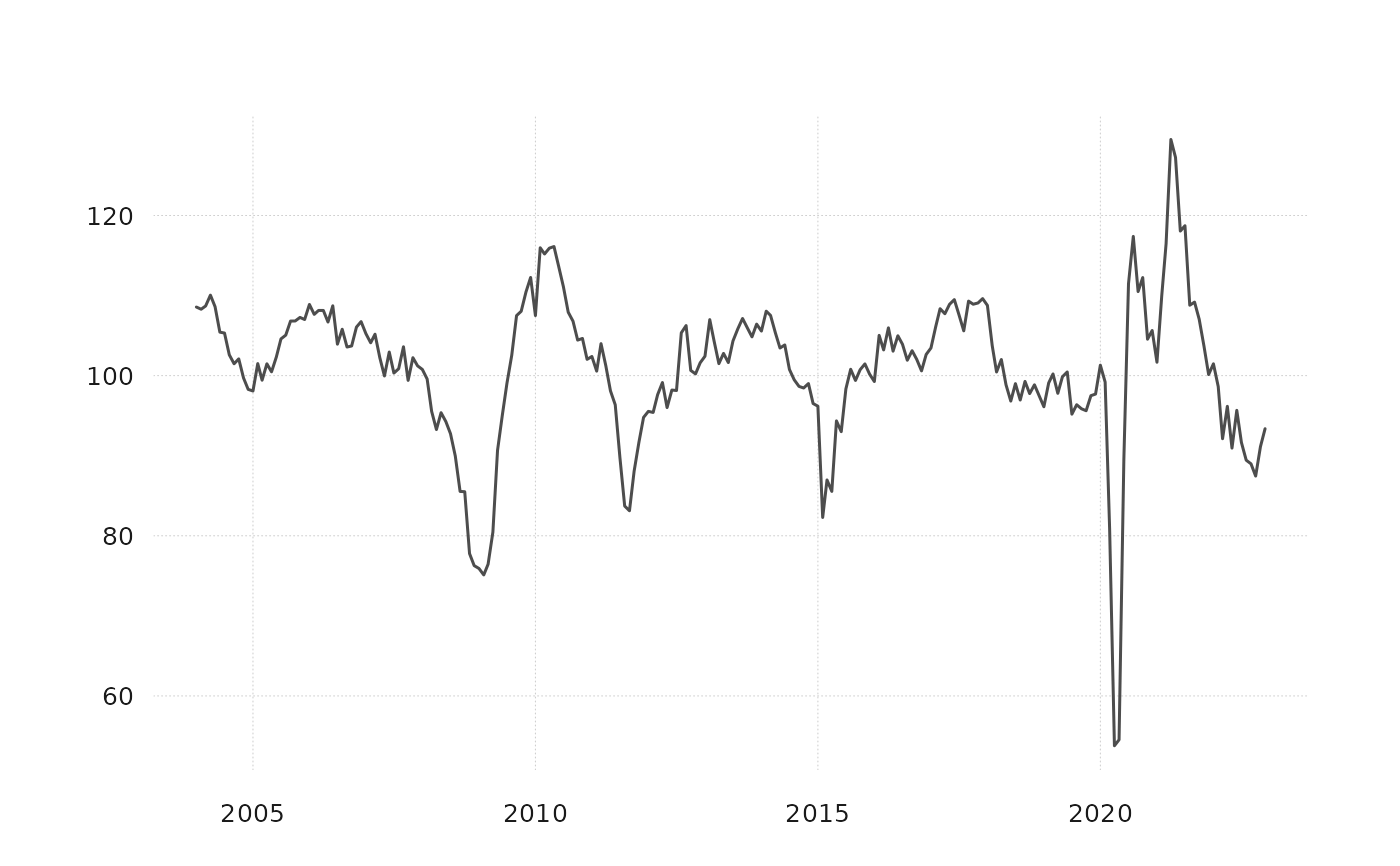
baro: The KOF barometer, a monthly business cycle indicator.fcurve: The F-curve, a daily business cycle indicator.gdp: Quarterly GDP data (real, seasonally adjusted).wea: The Weekly Economic Activity (WEA) indicator.
Datasets
baro:Source: KOF Swiss Economic Institute
Timeframe: January 2004 - December 2022
Frequency: Monthly
Format: A tibble with monthly observations and 2 variables:
time: Date, the month and year of the observation.values: Numeric, the value of the KOF barometer.
fcurve:Source: Burri and Kaufmann GitHub
Timeframe: January 2004 - December 2022
Frequency: Daily
Format: A tibble with daily observations and 2 variables:
time: Date, the date of the observation.values: Numeric, the value of the F-curve (inverted for compatibility).
gdp:Source: SECO
Timeframe: January 2004 - December 2022
Frequency: Quarterly
Format: A tibble with quarterly observations and 2 variables:
time: Date, the quarter and year of the observation.values: Numeric, the real GDP (seasonally adjusted).
wea:Source: SECO WEA Indicator
Timeframe: January 2005 - December 2022
Frequency: Weekly
Format: A tibble with weekly observations and 2 variables:
time: Date, the week and year of the observation.values: Numeric, the value of the WEA.
Examples
# Load and plot `baro`
data(baro)
library(tsbox)
suppressMessages(ts_plot(baro))